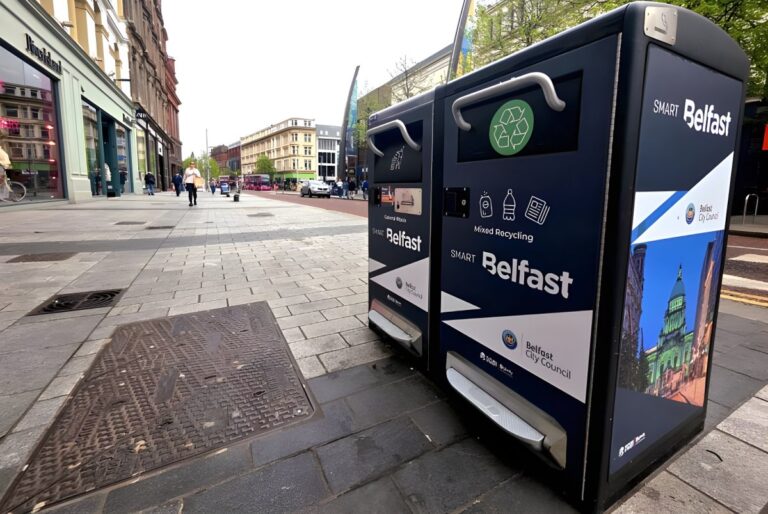
Bruxelles-Propreté, the Brussels Capital Region’s public cleanliness agency, has officially launched the second phase of its AI-powered street monitoring program, scaling from four vehicles to 16 trucks and extending coverage to 700 kilometres of roads across three municipalities: the City of Brussels, Anderlecht, and Ixelles.
From Pilot to Multi-Commune Operation
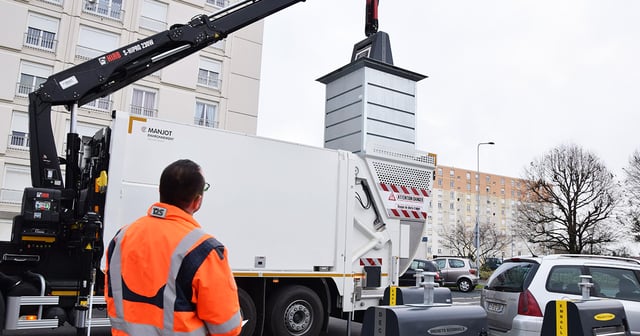
The first phase, which ran from March 2024, equipped four waste collection trucks with cameras and onboard computing hardware to scan approximately 337 kilometres of regional roads across ten communes. That pilot was assessed as positive, prompting the decision to continue with a broader and more structured test.
The second phase covers more than double the road network and consolidates the program into a focused collaboration with three municipalities. Data will be collected for a full year, during which the agency and its partner communes will analyse cleanliness patterns, seasonal variations, and the spatial distribution of waste. If the expanded trial meets expectations, a region-wide rollout across the full Brussels Capital Region could follow in 2027.
How the Technology Works
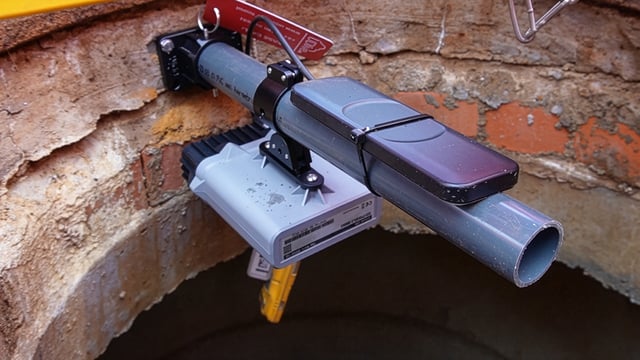
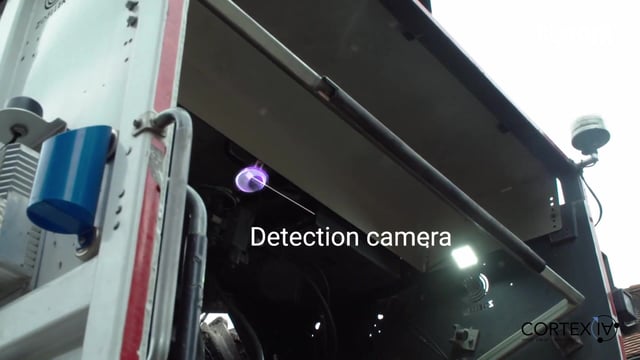
The detection system was developed by Swiss scale-up Cortexia, part of the Kurrant Ventures portfolio, which has an established client base across European cities including Hamburg, Zurich, Strasbourg, Montpellier, Nice, Ghent, and Charleroi. During the Brussels pilot, cameras mounted on garbage trucks identified the most common waste types found on Brussels streets, including cigarette butts, paper, plastic packaging, cans, dog fouling, and glass, then linked each detection to a mapped location and time period.
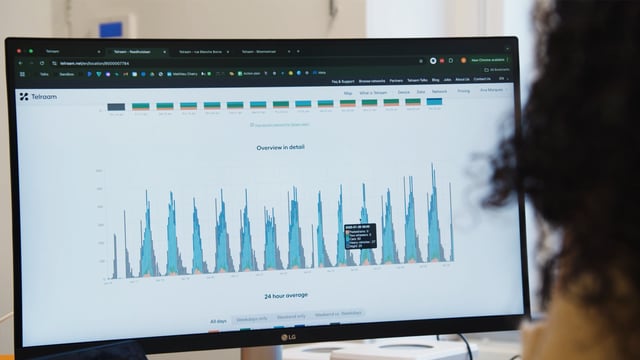
The data is processed on edge computing hardware onboard each vehicle before being transmitted via LTE to a central platform. There, results feed into the Clean City Index (CCI), a cleanliness scoring scale developed by Cortexia that runs from 0 to 5 and is displayed on a dynamic colour-coded map. Blue indicates a very clean road, green a satisfactory state, and red signals a road that falls below the agency’s threshold. The system is designed specifically to capture everyday litter, rather than illegal dumping, which is tracked separately.
Kurrant has previously reported on how Basel deployed Cortexia’s vision AI to map street cleanliness across 95% of its road network, using the same CCI framework to set measurable targets for its cleanliness teams and to guide bin placement decisions based on cigarette butt concentration data.
Operational Logic, Not Worker Surveillance
Officials at the launch were careful to set boundaries on what the tool is intended to do. “The AI project will not call into question the value of Bruxelles-Propreté workers,” said Jos Raymenants, Deputy Director of Bruxelles-Propreté, as quoted in RTBF’s June 2026 report.
The stated purpose is resource allocation: directing cleaning teams to where they are most needed, rather than tracking individual worker performance. Ixelles councillor for cleanliness Geoffroy Kensier described the tool as a way to put “the right staff in the right place at the right time.”
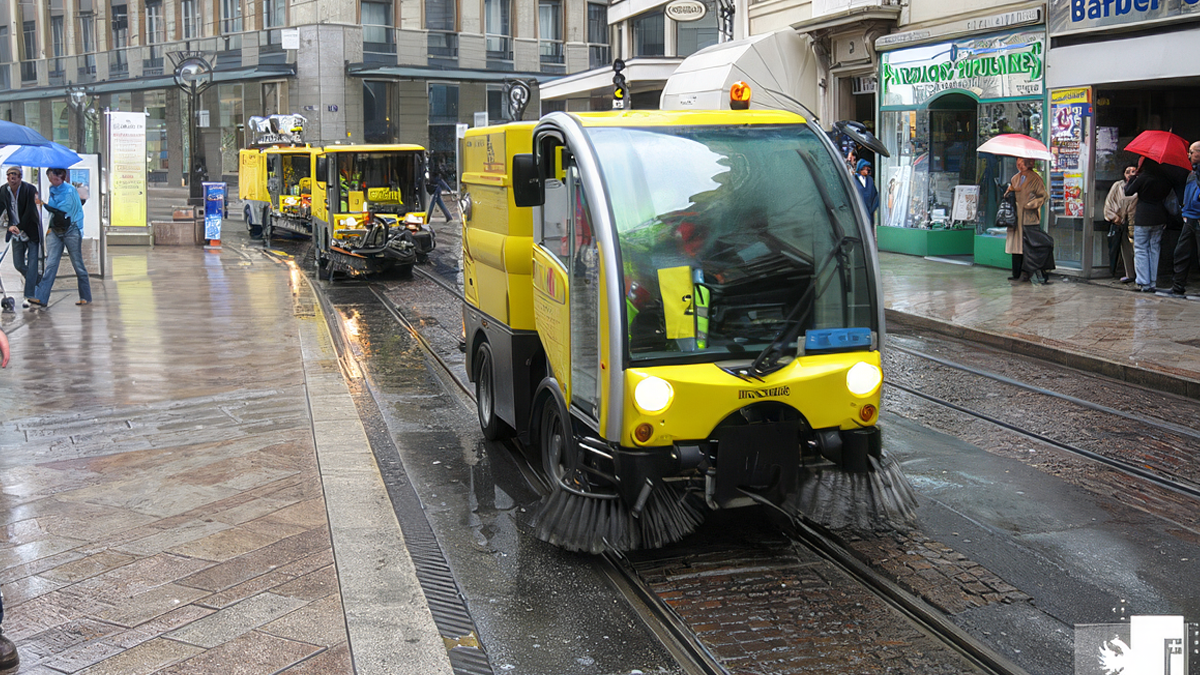
The distinction carries operational weight. If the data shows certain roads are being cleaned at a frequency that exceeds what their cleanliness scores justify, those resources can be redistributed. This is the same logic applied in Basel, where cleanliness teams used Cortexia data to identify over-cleaned streets and reduce unnecessary sweeper runs, which have a meaningful energy cost.
A Measurable Problem in a Politically Sensitive Context
Urban cleanliness is a persistently contested topic in Brussels, where debates about the state of public space often map onto broader questions of municipal governance across the region’s 19 communes. By producing a standardised, location-anchored cleanliness index, the agency aims to shift those debates toward measurable ground.
The pilot also produced a working framework for measuring the impact of specific interventions: relocating or removing a public bin, running a prevention campaign, or adjusting collection frequency on a given axis. That kind of before-and-after measurement has historically been difficult to conduct in a systematic way.
The one-year data collection window starting from this second phase is designed to capture seasonality, which matters for litter patterns. Cigarette butts and packaging tend to concentrate differently in summer outdoor dining areas than in winter commuting corridors, and the time-linked mapping allows the agency to plan accordingly.